Actions
Bug #12585
open
Bug #12583: Grafana related issues
Incorrect statistics in Device vendors in grafana
Status:
New
Priority:
Medium
Assignee:
-
Start date:
11/02/2025
Due date:
% Done:
0%
Estimated time:
Device Type:
Component:
Type:
Platform
QA Start Time:
QA Due Time:
QA Estimated Time(Hours):
Description
Environment details
Staging server 6.4.0
Prerequisites
Setup grafana
couple of enrolled devices
some should be in removed state.
both android and windows devices
Steps
go to dashboad: https://uem.mgt.entgra.net/endpoint-mgt/dashboard
Check "Device vendors".
Description
There are 6 devices in the all device page [1].
but in the device vendors it shows only 4 devices [2]
Added DB dump of the staging server: [3]
Note: In "Device hardware" analytics, both charts are incorrect [4]
https://uem.mgt.entgra.net/endpoint-mgt/analytics/device-hardware
Device Vendors (Top 10)
Device Models (Top 10) [4]
Result
[1]![[1]](/attachments/download/4642/Screenshot%20from%202025-02-11%2017-21-21.png "[1]")
[2]![[2]](/attachments/download/4641/Screenshot%20from%202025-02-11%2017-18-30.png "[2]")
[3]
Db dump [3]
find the db dump in the file section
[4]![[4]](/attachments/download/4652/Screenshot%20from%202025-02-11%2017-37-04.png "[4]")
Files
 Updated by
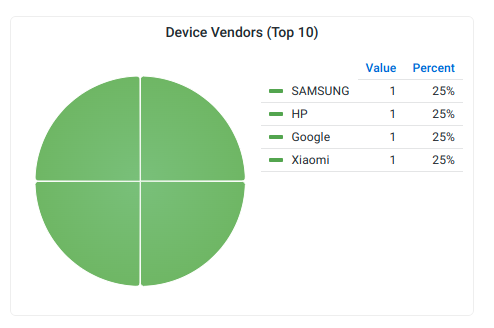
Actions